|
 Figure 9A
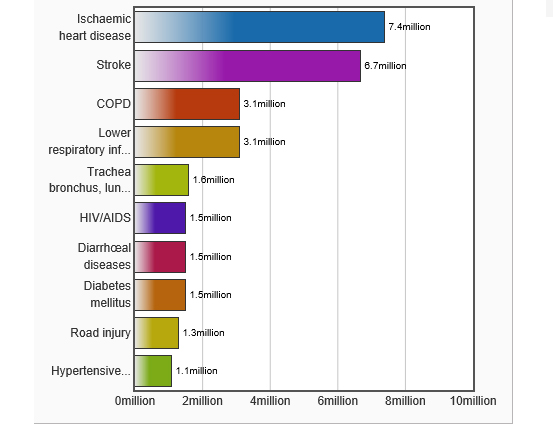
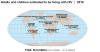
Leading causes of death worldwide 1999
WHO
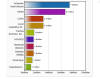 Figure 9B
Leading causes of death worldwide 2012
WHO
 Figure 9C
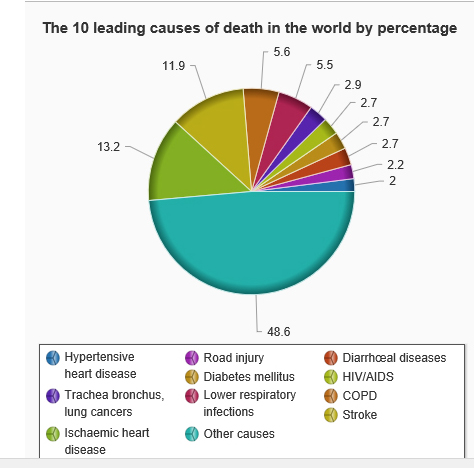
Leading causes of death worldwide in 2012 as a percentage
 Figure 9D
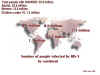
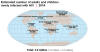
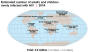
New HIV infections, AIDS deaths and people living with HIV worldwide
1990-2007
WHO
FIGURE 9
|
AIDS is defined in persons older than 13 years as the presence of one of 25
conditions indicative of severe immunosuppression or HIV infection in an
individual with a CD4+ T-cell count of less than 200 cells per cubic mm
of blood. AIDS is the end point of an infection that is continuous, progressive
and pathogenic. With the prevalence of HIV in the developing world, HIV and its
complications will be with us for many generations to come. AIDS is now a
leading cause of death worldwide although as a result of anti-retroviral therapy
it has now fallen to sixth place (figure 9).
In the past thirty years, AIDS has
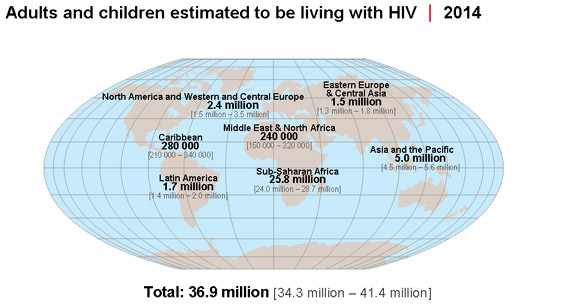
taken more than 39 million lives around the world. In 2014, it was estimated
that there were about 36.9 million HIV-infected people in the world of whom about
70% were in
sub-Saharan Africa where the adult infection prevalence is about 6%. In the
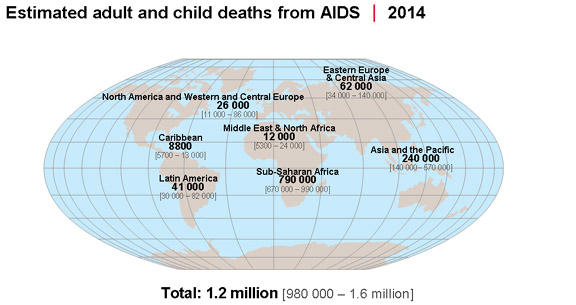
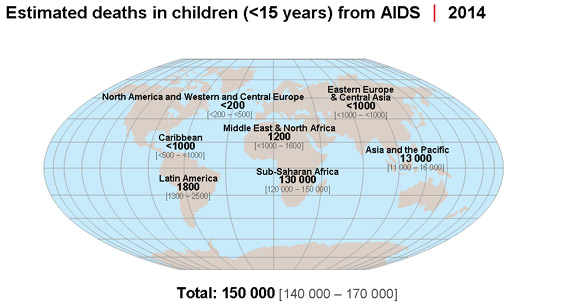
same year, 1.2 million people died of whom 150,000 were children under the
age of 15.
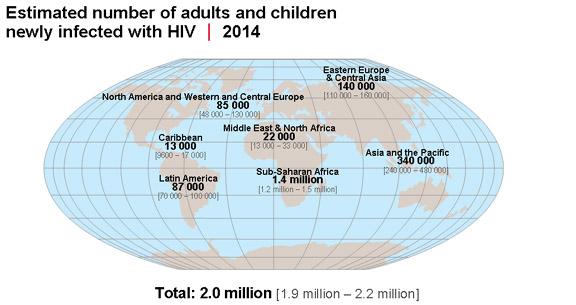
Approximately 6,000 new HIV
infections occur daily around the world, that is 2 million in 2014 (of whom
220,000 were under 15 years of age). Over 90% of the new infections are in developing
countries. Forty per cent of adult
infections are in women and 15% in individuals of 15 - 25 years of age.
Until recent years, peri-natal infection resulted in a large number of children being born with
HIV but infection by this route can usually be stopped using anti-retroviral
drugs. 30-50% of mother to child transmissions of HIV results from breast feeding.
More than eight million people living
with HIV in 2011 received antiretroviral therapy in low- and middle-income
countries and The World Health Organization estimated that another 7 million
people needed to be enrolled in treatment to meet the target of providing
anti-retroviral therapy to
15 million people by 2015.
That goal was achieved and in March 2015 15 million infected people were being treated with
anti-retroviral therapy. Nevertheless, this remains a minority of infected
people. However, because of treatment strategies and education, the number of
new HIV infections and deaths from AIDS appears to have peaked (figure 9D)
|
 Figure 10A
Evolution of an epidemic. Estimated AIDS incidence in the US through 2000
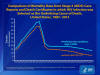 Figure 10B
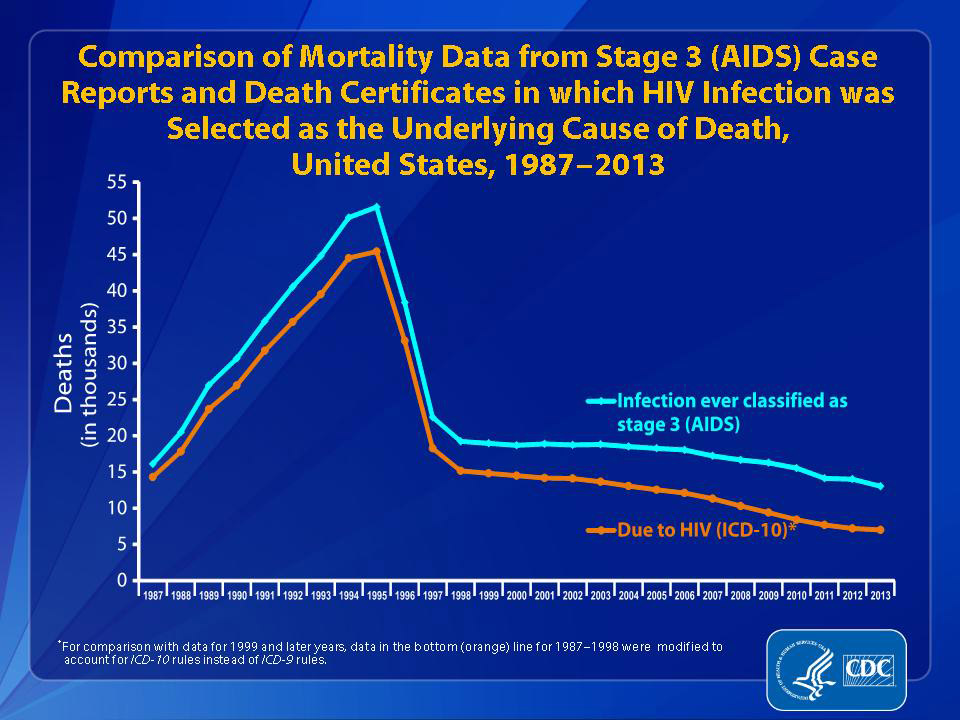
Comparison of Mortality Data from Stage 3 (AIDS) Case Reports and Death
Certificates in which HIV Infection was Selected as the Underlying Cause of
Death, United States, 1987−2013
 Figure 10C
Diagnosis of HIV among
adults and adolescents in the US by gender (2009-2011).
From 2008 through 2011, the number of diagnoses of HIV infection among
adult and adolescent females decreased; the number among males remained
stable. In 2011, an estimated 50,007 adults and adolescents were
diagnosed with HIV infection; of these, 79% of diagnoses were among
males and 21% were among females. CDC

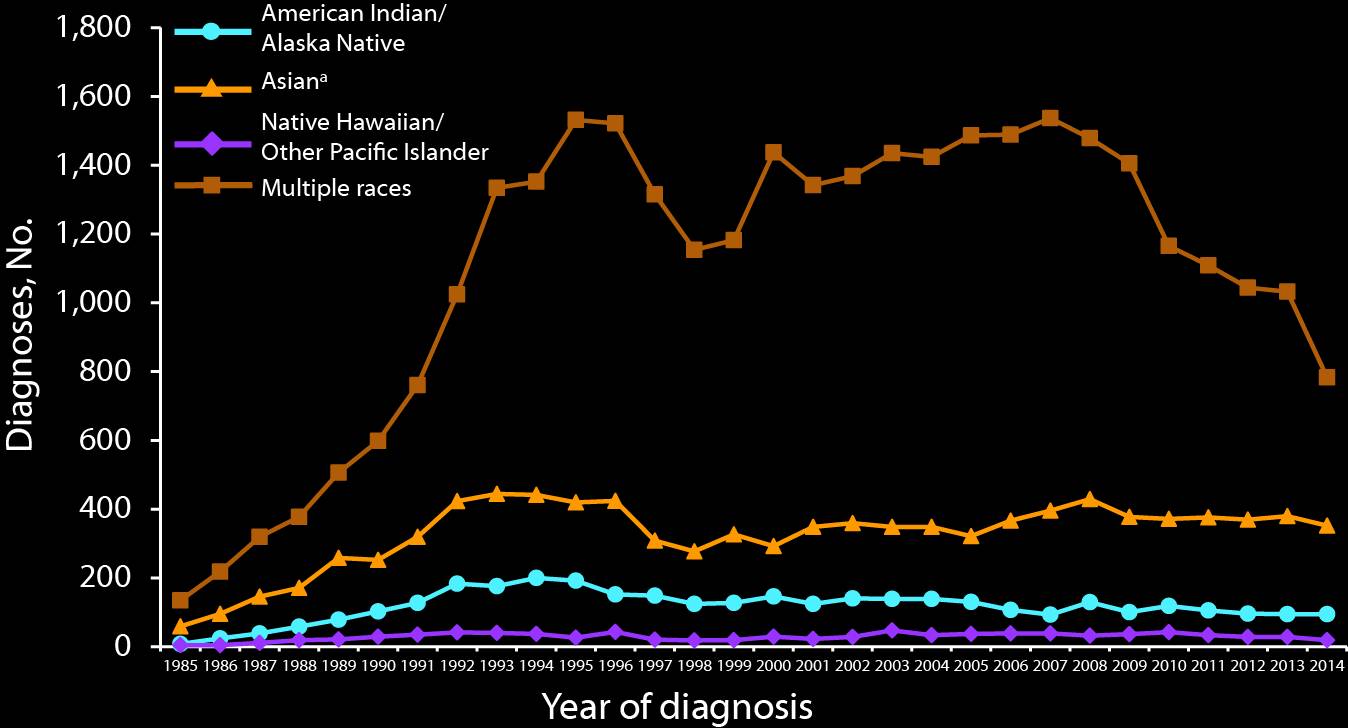
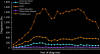 Figure 10D
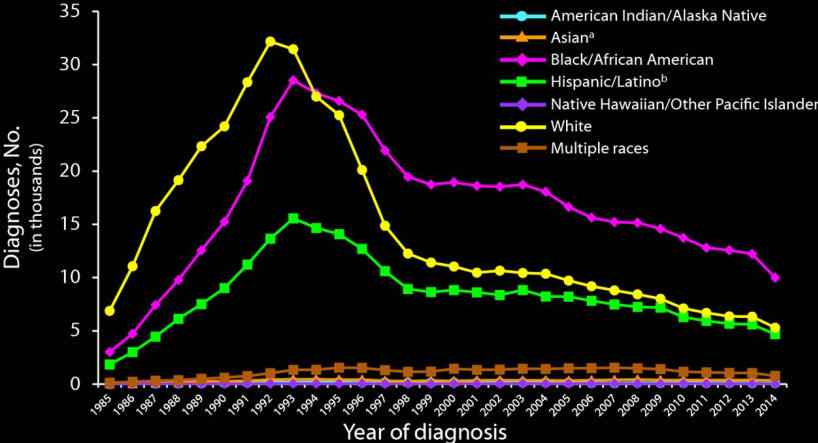
Stage 3 (AIDS) Classifications among Adults and Adolescents with HIV
Infection, by Race/Ethnicity 1985–2014
CDC
 Figure 10E
Distribution of diagnoses of HIV
infection among adults and adolescents diagnosed from 2008 through 2011, by
transmission category.
The percentage of adults and adolescents with diagnosed HIV infection
attributed to male-to-male sexual contact increased from 55% in 2008 to 62%
in 2011. The percentages of diagnosed HIV infections attributed to injection
drug use, male-to-male sexual contact and injection drug use, and
heterosexual contact remained relatively stable (less than a 5% increase or
decrease) from 2008 through 2011. A very small percentage of diagnosed
infections each year were attributed to other transmission categories. CDC
 Figure 10 F
Annual number of new HIV infections transmitted per 100 persons living with
HIV.
This figure is calculated by dividing HIV incidence for a given year by HIV
prevalence for the same year, and multiplying this number by 100. CDC |
United States Statistics from
Centers for Disease Control
HIV/AIDS was first seen in the United
States in the 1980s and grew into an epidemic that made it one of the leading
causes of death. Since then, the number of cases has reduced (Figure 10A, B).
Total number of
HIV-infected people
At the end of 2013, CDC released new
estimates of the extent of the HIV/AIDS epidemic. These showed that
approximately 1 million
persons (950,811) aged 13 years and over were living with diagnosed HIV infection (about 500 per 100,000
population). This number is relatively stable. In addition, 144,000 persons (12.8%)
are estimated to have an undiagnosed HIV infection. The 2013 number of
HIV-infected Americans compares
with approximately 994,000 infected at the end of 2003 and 641,086 in
1996.
Infected men heavily outnumber
women with
718,300 diagnosed infections in males and 232,511 cases in females (figure
10C). The racial distribution of these infected persons was:
Race
(Figure 10 D) |
Per cent of total
infections |
|
Males |
Females |
| White |
36 |
17 |
| African Americans |
36 |
59 |
| Hispanic |
23 |
19 |
| Asian |
~1 |
~1 |
| Amer. Indian/Alaska
Native/Pacific Islander |
<1 |
<1 |
| Multiple races |
~3 |
~3 |
HIV prevalence rates
among blacks or African Americans (1,819.0 per 100,000 population) and Hispanics
or Latinos (592.9) were approximately eight times and two and a half times the
rate among whites (238.4).
The mechanism by which HIV
infection was contracted in the United States was:
Mechanism
(Figure 10E) |
Per cent of total
infections |
| |
Males |
Females |
| Male to male sexual
contact |
69 |
NA |
| Injected drug use |
12 |
23 |
| Male to male
contact and injected drug use |
7 |
NA |
| Heterosexual sexual
contact |
11 |
74 |
| Perinatal exposure |
~1 |
~ |
| Other including
hemophilia and blood transfusion |
~1 |
~1 |
New infections
It is estimated that 40,000 - 50,000 people
are newly infected with HIV each year. In 2014 this figure was 44,609 (down from 47,352
in 2013). Of these 81% were adult or adolescent males and 19%
were adult or adolescent females. The were an estimated 187 new cases in
children under 13. The number of new infections in females is decreasing while
those in males is holding steady (figure 10F).
Almost two thirds of the newly infected are
gay and bisexual men (Figure 10F, 10J) and nearly half are black or African American
(Figure 10G-J,K). . Infections in females in the United States is usually
via heterosexual contact with infected men (Figure 10H) and the highest numbers
are among African American females (Figure 10L).
|
|
More CDC Information on
HIV and AIDS in the United States
Figure 10F - 10N |
|
Diagnoses of NEW HIV infectionS by
age IN 2011 AND
2013 |
| |
2011 |
2013 |
| Under 13 years |
165 |
187 |
| 13-14 years |
44 |
45 |
| 15-19 years |
1936 |
1863 |
| 20-24 years |
6943 |
8053 |
| 25-29 years |
6397 |
7825 |
| 30-34 years |
5311 |
6165 |
| 35-39 years |
4515 |
4858 |
| 40-44 years |
4909 |
4820 |
| 45-49 years |
4734 |
4961 |
| 50-54 years |
3383 |
3747 |
| 55-59 years |
1979 |
2467 |
| 60-64 years |
1057 |
1316 |
| 65 years and
older |
1808 |
1045 |
| TOTAL |
43181 |
47352 |
|
ANNUAL
CASES OF HIV INFECTION BY ETHNICITY
2011 and 2013 |
| Race or
ethnicity |
Cumulative
AIDS cases |
| |
2011 |
2013 |
| White, not Hispanic |
11996 |
13101 |
| Black, not Hispanic |
19846 |
21836 |
| Hispanic |
8555 |
10117 |
| Asian/Pacific Islander |
821 |
973 |
| Native
Hawaiian/Pacific Islander |
68 |
67 |
| American Indian/Alaska Native |
188 |
218 |
| Multiple races |
707 |
1039 |
| |
|
TRANSMISSION OF HIV IN THE UNITED STATES
NUMBER OF ADULT CASES IN 2011 AND 2013 |
|
Male |
Female |
| |
2011 |
2013 |
|
2011 |
2013 |
| Male to
male sexual contact |
21005 |
30689 |
Injected
drug use |
613 |
1154 |
| Injected
drug use |
1052 |
1942 |
Heterosexual sex |
3,703 |
8031 |
| Male to
male sex and injected drugs |
916 |
1270 |
Other* |
4479 |
93 |
|
Heterosexual sex |
2600 |
3887 |
|
|
|
| Other* |
36 |
99 |
|
|
|
| TOTAL |
33221 |
37887 |
TOTAL |
8795 |
9278 |
| *
Includes hemophilia, blood transfusion, perinatal exposure, and risk
factor not reported or not identified. |
|
TRANSMISSION OF HIV IN THE UNITED STATES
NUMBER OF CHILD CASES IN 2011 |
| Perinatal |
110 |
| Other* |
55 |
| TOTAL |
165 |
| *
Includes hemophilia, blood transfusion, and risk factor not reported
or not identified. |
Patients with AIDS
In 2006, the estimated number of
persons living with AIDS (i.e. overt disease rather than infection by the virus)
in the United States and dependent areas was 448,871. In the 50 states and the
District of Columbia, this included 432,915 adults and adolescents, and 3,775
children under age 13 years.
In the early years of the
epidemic, AIDS incidence increased by 65 - 95% each year but partly as a
result of prevention efforts targeting those at highest risk, the rate of
increase fell to less than 5% per year by the mid 1990's. This was prior to
the introduction of combination therapies for HIV. In 1996, estimated
AIDS incidence dropped for the first time, declining 6%. Deaths among people
with AIDS also declined for the first time in 1996, dropping 25% (Figure
10A).
Because of anti-retroviral
therapy, most infected persons do not now progress to overt disease (stage 3
AIDS) and so, as many patients infected in the earlier stages of the
epidemic have died, the number of people living with overt the
manifestations of the disease (rather than an HIV infection) has decreased
dramatically. In the United States, the number of people with stages 3 AIDS
in 2013 was 26,688 (20,256 males, 6,424 females and 8 children under 13).
It should be noted that as more and more people survive
with an HIV infection because of successful chemotherapeutic intervention,
the number of infectious people in the population is rising even though fewer
people are dying of AIDS (figure 10C). Thus, if declines in AIDS deaths continue, there will also be an increase in HIV
prevalence, pointing to an increased need for both prevention and treatment services.
Deaths in the United
States
At least 658,000 infected
Americans have died of AIDS including 13,713 in 2012. Of these, about 1%
were children under 13.
|
|
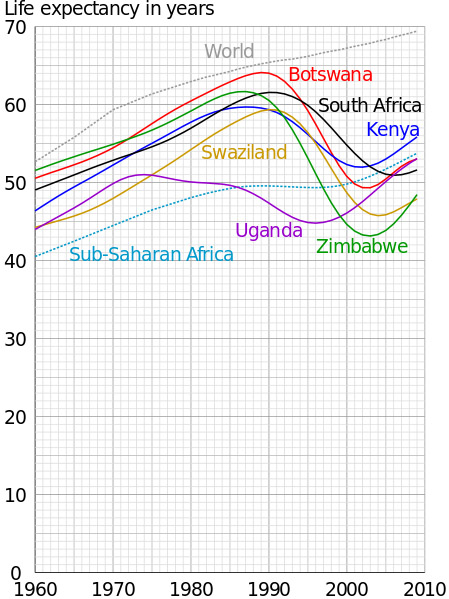
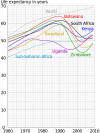 Life expectancy in sub-Saharan Africa and
the world. 1960 - 2010
Life expectancy in sub-Saharan Africa and
the world. 1960 - 2010
 Global trends in people living with HIV,
new infections and deaths 1990-2011 UNAIDS
Global trends in people living with HIV,
new infections and deaths 1990-2011 UNAIDS
FIGURE 11
TOTAL INFECTIONS
 1998 1998
 2005
2005
 2011
2011
 2014
2014
Adults and children living with HIV
UNAIDS
 2014 children
UNAIDS
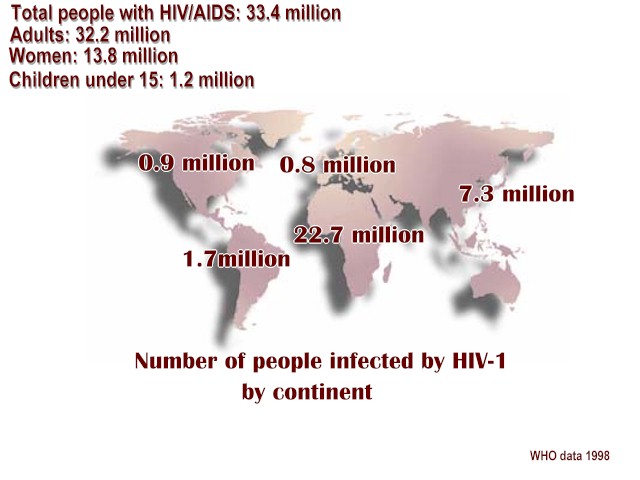
Total HIV infection statistics by continent
Figure 12A
NEW INFECTIONS
 2014 Adults and children
 2014 Children
DEATHS
 2014 Adults and children
 2014 Children
Figure 12B
Number of people newly infected with HIV,
2001–2011, by region UNAIDS
Figure 12C |
World Statistics from The World Health Organization
and UNAIDS
In 2001, there were a total of 29 million
people in the world, including 2.6 million children, who were HIV-infected. A decade later, in 2011, this number
had risen to 34 million (figure 12B) of whom 19 million did not know that they
are infected. This is an estimated 0.8% of adults aged 15 to 49 years
worldwide, although the burden of the epidemic continued to vary considerably
between countries and regions. Most of the rise in the last decade has been in
sub-Saharan Africa. In 2014, it is estimated that 36.9 million people were
HIV-infected (of whom some 15 million are receiving anti-retroviral drugs).
Globally, the number of new infections annually has fallen from 3.2 million to 2.1 million, largely because of access to
anti-retroviral treatment. Similarly, the estimated annual number of deaths has
fallen to 1.2 million in 2014..
By the year 2000, HIV infections leveled off in the west and
the wave of infections threatening to affect western heterosexuals has not materialized.
However, this was not the case elsewhere and there were huge increases in
southern Asia and southern Africa. Now, however, the number of new infections is
falling in most of the world (figure 12C). According to UNAIDS, twenty-three of
the countries with steep declines in HIV infection rates are in sub-Saharan
Africa. In this region, about 1.8 million people became
HIV-infected in 2011. This was 25% lower than in 2001 (about 2.4 million). However, sub-Saharan Africa accounted for 71% of the
adults and children newly infected in 2011. Unfortunately, the trend is less
favorable in several other countries and in at least nine countries (Bangladesh,
Georgia. Guinea-Bissau, Indonesia, Kazakhstan, Kyrgyzstan, Philippines, Republic
of Moldova, Sri Lanka), the number of people newly infected in 2011 was at least
25% higher than in 2001.
The number of deaths from AIDS started
to decline in the mid-2000s (Figure 9D). This was due to the greater availability of
antiretroviral drugs and the steady decline in HIV infection which reached a
maximum in 1997. This decline has continued and the fall in the number of
AIDS-related deaths is accelerating in several countries.
In 2014, approximately 1.2 million
people died worldwide from AIDS-related causes which represents a 48% decline in
AIDS-related mortality compared with 2005 when approximately 2.3 million
AIDS-related deaths occurred.
In 2014, 220,000
children became HIV-infected which represents
a 60% decline since 2003 (560 000 new infections in children) and a 49% drop since 2009 (430
000 new infections in children). More than 86% of the children who acquired HIV infection in 2014 live in sub-Saharan Africa.
Africa
In sub-Saharan Africa, there are an
estimated 25 million (range: 24.0 million – 28.7 million, 2014 figures) people infected by HIV with
over 1.4 million new
infections in 2014. This means that one in twenty adults is infected which is
4.8% of the population. In 2001, there were 20.9 million infected people in
sub-Saharan Africa (a rise of 20% between 2001 and 2014) with 2.4 million new
infections. Thus, in the first fourteen years of the 21st century, new HIV infections
fell substantially.
The number of people dying from
AIDS-related causes in sub-Saharan Africa declined to 790,000,
although the region still accounts for 70% of all the people dying from AIDS. In contrast to
western countries, young African women are more likely to be infected with HIV than
young men. According to UNAIDS, 60% of new HIV-infections in sub-Saharan Africa
are young females and the gap is increasing. Women are
being infected with HIV at an earlier age than men in most countries in
sub-Saharan Africa. The differences in infection levels are most pronounced among young
people (aged 15 – 24 years) with, on average, 36 young women living with HIV for
every 10 young men in sub-Saharan Africa.
AIDS was responsible for a decrease in life
expectancy in sub-Saharan Africa and an increase in child mortality but with the
widespread availability of anti-retroviral therapy, the life expectancy has
begun to rise again. (figure 11).
The overall infection rate for adults
in sub-Saharan Africa in 2006 was 5.9% but several countries in sub-Saharan Africa report infection rates
of over 30% in urban areas. In some Kenyan and Zambian towns, 1 in 5 girls is HIV-positive by the age
of 20. In men over 25, the percentage who are HIV-infected can be as high as
40%. In Botswana, the proportion of the adult population living with HIV more
than doubled
over a period of six years, with almost half of pregnant women testing HIV-positive in the major urban center of Francistown. In 2011, the country reporting the highest level of infection was
Swaziland with a rate of 26% (190,000 people). South Africa has the highest
total number of HIV-infected people at 5.6 million of whom 2.9 million are
women.
Since 1995, anti-retroviral therapy
has saved 14 million life-years in low- and middle income countries, including 9
million in sub-Saharan Africa.
Asia-Pacific
In 2014, about 340,000 people in the
Asia/Pacific region (South and South East Asia and Oceana) became infected by HIV
including 21,000 children. The total
infected population in this region is an estimated 5 million people (range 4.5
million - 5.6 million) with 200,000 of these being aged under 15. There were
240,000 AIDS-related deaths in 2014 including 13,000 children.
In India, the infection rate is under 1% but this means that there
were 2.1 million infected people which puts India
behind only South Africa in total number of cases. Much of the Indian
epidemic of HIV infection results from intravenous drug use.
China has a less severe problem with
an estimated 780,000 (620,000-940,000) HIV-infected people in 2012
(prevalence rate: < 0.1%). In 2004, it was predicted that if nothing were done to prevent
an increasing infection rate, China would have 10 million cases by 2010.
However, this has not materialized.
Access to treatment in low to
middle income countries
According the the UNAIDS, just 2.9
million HIV-infected people were receiving anti-retroviral drugs in 2007 but
anti-retroviral therapy reached 8 million people by the end of 2011. This number
rose to 15 million in 2015.
|
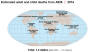
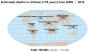
 Figure 10A
 Estimated number of AIDS related deaths worldwide 1980-2000 WHO